I had posted a recent report that showed that one of the major papers supporting austerity actually messed up the analysis due to a simple Excel mistake. Since then, this issue has exploded over the Internet! Krugman has been lambasting them, but that's hardly surprising. Alexandra Petri has a funny piece on the subject. One of the best analysis I read on it was in the New Yorker.
Brad Plummer has a fantastic piece on the subject. Here's the part that caught my eye:

Brad Plummer goes on to note:

Brad Plummer has a fantastic piece on the subject. Here's the part that caught my eye:
But a new critique (pdf) by Thomas Herndon, Michael Ash and Robert Pollin claims that this result may need revision. For one, the economists argue that Reinhart and Rogoff excluded three episodes of high-debt, high-growth nations — Canada, New Zealand, and Australia in the late 1940s. Second, they argue, Reinhart and Rogoff made some contestable assumptions about weighting different historical episodes.
Now, those are two methodological objections. But there’s also a third problem, as Mike Konczal details here. Reinhart and Rogoff appear to have made an error with one of their Excel spreadsheet formulas. By typing AVERAGE(L30:L44) at one point instead of AVERAGE(L30:L49), they left out Belgium, a key counterexample:
Brad Plummer goes on to note:
It’s worth emphasizing, however, that the Excel coding error itself is only responsible for a small portion of this difference in results — about 0.3 percentage points. So the spreadsheet mistake, by itself, does not appear to be fatal. Here’s the difference between the two studies in chart form:
Brad Plummer's article cites a number of sources that raise other objections. However, the key concession in Reinhart and Rogoff's response is: "By the way, we are very careful in all our papers to speak of “association” and not “causality” since of course our 2009 book THIS TIME IS DIFFERENT showed that debt explodes in the immediate aftermath of financial crises."
So, let me put that simply.
Reinhart and Rogoff found, and this has been found by others, that countries with slow growth often have high Deebt-to-GDP ratios. This is not disputed. People reading their report had suggested that there is an inflection point at 90% debt-to-GDP where growth becomes negative. The new revelations suggest that this inflection point was wrong and based on a calculation error. So, what is the position with respect to debt and GDP? The answer is unclear. The reason is that critics basically argue that its more likely that slow growth causes high debt-to-GDP than the other way around. Recent IMF recommendations to push for less austerity suggest that they have concluded the causality runs the other way too.
Finally, let me point out that debt-to-GDP is likely the wrong metric. Why? Well because debt is a balance sheet number and GDP is a P&L or flow number. Comparing the two isn't very meaningful. If an underwriter did this for a company, he'd be fired. Yes, I understand that macroeconomics is different, but still, I am not sure that in this case the underlying criticism is that far wrong.
What may be more useful is either Debt-to-asset ratio. However, I conjecture that a debt servicing-to-GDP ratio may be much more effective. The idea is that countries with high risk have very high borrowing costs and so much higher debt servicing obligations for the same level of debt than countries with lower borrowing costs. So, the impact of debt would be the joint effect of the total debt burden and the sovereign interest rate and not just the debt alone. I would hazard a guess that the debt obligation is effectively a tax and should have similar effects on economic growth.
If my conjecture is correct, then higher debt should lead to slower growth, but lower interest rates could offset the effect.
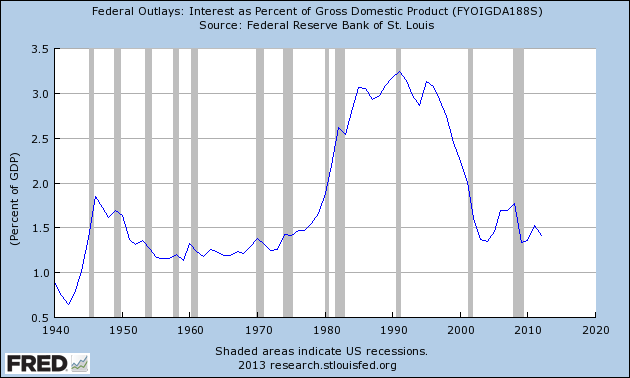
So, how is the US doing? Here is a chart that shows the interest payments as a percentage of GDP:
As Joel Kurtzman, the author of the article from which this chart was sourced points out, the debt servicing obligation (interest) as a percentage of GDP is actually pretty affordable, and even the CBOs "alternative fiscal scenario" which takes away the rosy assumptions of the Obama/Ryan budgets put interest costs at not more than ~5% of GDP. Make no mistake, that's large. That's one of the largest obligations in the Federal budget. However, the US isn't about to go bankrupt any time soon with that level of debt servicing obligation.
No comments:
Post a Comment