Thursday, January 31, 2013

Does Genius Fail?

The popular perception of geniuses are these crazily brilliant people who seem to effortlessly excel at everything.  This is the view that Hollywood evangelizes.  This is the view that every interview with or article that cites a "Nobel Prize Winner" essentially assumes, as if a Nobel Prize indicates infallibility.  But, is this really right?

Malcolm Gladwell's answer is an emphatic no.  In Malcolm Gladwell's "Outliers", Gladwell argues that a lot of what makes for genius is just plain dumb luck and perseverance.  Gladwell suggests that one of the biggest things that seems to separate geniuses from the rest is that they spend a lot more time practicing.  In his book, he grabs on to the magical number - 10,000 hrs of practice.

Now, I have to say that while I found the concepts in his book very compelling, his analysis left me cold.  At one point in the book he lists some of the wealthiest people in the world through history and proceeds to make a number of assertions about the list.  The problem is that his list seems inexact and incomplete at best and dubious at worst.

Anyway, recently I came across a totally different approach to making a somewhat similar point in Joel Achenbach's blog. The article was one he had apparently written in 1995 (which means he beat Gladwell to the idea by a fair bit).  What Achenbach argues is that if you look around you'll find examples of really poor output from geniuses.  He illustrates this pointing to examples from Beethoven, Shakespeare, Einstein, etc.  Geniuses are often wrong.  They often produce mediocre if not bad output.  Yet, what sets geniuses apart is that they persevere.

I am not sure Achenbach is more conclusive than Gladwell, but read together, they make a persuasive case that perseverance and practice are important factors in being a genius, and natural talent without effort probably won't lead to genius.

Wednesday, January 30, 2013

Shrinking economy?

If you missed the news, the US economy actually shrank by 0.1% in Q4 2012.  The GOP is ecstatic.  Jennifer Rubin has a post suggesting that this is an indictment of Obama's policies.

Let's all take a deep breath.  Why did the economy shrink?

One of the best analysis of this is actually on the Wonkblog (as usual):

q4_gdp


A significant reason for the contraction is that the drop in defense spending.  Other reasons are that companies simply ran down inventories (possibly in anticipation of a slowdown resulting from the fiscal cliff?) and a sharp decline in exports driven by a global slowdown.

Good news #1:  The inventories part if probably a one time blip and will correct itself.

Good news #2: government spending is down.  The defense spending reduction it is speculated can be attributed to two things:

  1. A natural pattern of defense spending where it always rises in Q3 and drops in Q4; and
  2. A preparation for the sequester, knowing that they cannot really cut spending on a dime.
This also continues a longer term trend in cuts in government spending as seen from this chart:
Source: White House


The Private sector has been growing at over 2% and possibly over 3%.  If government spending had been flat, then the US economy's growth rate would have been north of 3%.  However, between budget cuts agreed by Obama and state government cuts, there is a significant drag due to the public sector pull backs.

What this economic report underlines though is that if the sequester goes into effect, the US economy will be plunged into recession.  Possibly a contraction of over 8%.  Let me put that in perspective.  That is a larger drop in US GDP than occurred in 2008-09.  The fact is the costs have to be brought under control, but the question is whether causing a recession is the way to do it.  Volcker's experiment in the 80s would suggest it may be OK.  However, austerity experiments in UK and the EU in general call this into question.

Wednesday, January 16, 2013

Obama's gun control proposals

Here is a wonderful summary of Obama's gun control proposals and who needs to act on it.  A bunch of these are relatively non controversial executive actions that Obama has proposed to take immediately - here's the list of executive actions.  The Washington Post also has an excellent piece on the likelihood that  the proposals that require Congressional action will pass.

Here's what took me by surprise.  Obama can, by executive order, limit import of certain types of weapons. It is interesting that the idea of restricting imports was not something he has opted for.  It seems he is banking on Congress for the more controversial stuff.  On the one hand, it is true that Congressional action would be a lot more effective, on the other, it means that there is a lot more he could have done but is not doing.  It  suggests that he is being cautious about not using his executive authority in a way that overly muddies the debate.

Tuesday, January 15, 2013

How hot was 2012 part deux

Nasa has posted an excellent set of graphics that show just how hot 2012 was.  

The site points out that: "NASA scientists say 2012 was the ninth warmest of any year since 1880, continuing a long-term trend of rising global temperatures. With the exception of 1998, the nine warmest years in the 132-year record all have occurred since 2000, with 2010 and 2005 ranking as the hottest years on record." 

This map represents global temperature anomalies averaged from 2008 through 2012.
Data source: NASA Goddard Institute for Space Studies
Visualization credit: NASA Goddard's Scientific Visualization Studio

 http://www.nasa.gov/images/content/719282main_2008_2012_printdata.1462.jpg

I'd encourage you to visit the site which also has a great video animating the progression of the global temperatures for the period from 1880 to 2012 relative to the average from 1951 to 1980.  Fascinating to see how the earth has warmed.

Pretty alarming!

How not to negotiate ...

I came across this fascinating article on the fiscal cliff negotiations.  Here is the key chart:


To explain what happened, consider the total deal amount of each offer:


Before Boehnor decided to abandon negotiations, the two sides were basically looking at roughly the same aggregate deficit reduction number.

What about the composition?

Well, Obama and Boehnor were basically within about $200B on nearly every item by 12/18/12.  That's basically within roughly 20% of Boehnor's numbers.

What did they finally land up with?  Well, roughly $650B in tax increases and north of $100B in interest savings.  Hmmm ... to think they could have agreed to stabilize debt completely and were that close and then walked away!

If you consider that the GOP walked away from a $4.5T deal the first round and a $2.6T deal this round all to protect taxes, only to see tax hikes with nearly no spending cuts, you have to wonder whether the GOP purists have any idea how damaging their all or nothing approach is to their objectives.

Perhaps the next round of brinkmanship will prove me wrong, but as of now, it does seem like the GOP has walked away from some really sweet deals.


Do we have a deficit problem?

Paul Krugman in a recent article points out that while there continues to be a long term deficit problem that we need to solve at some point, the fact is that the deficit problem is not that much of an issue at the moment.  To support his claim, he points to analysis done by the Center on Budget and Policy Priorities.

Here's the key chart:


The dark blue line here is the projected deficit in 2011 before Obama and Congress started to take action.  The light blue line includes the cuts Obama already agreed to a bunch of cuts in the 2011 Budget Control Act (BCA), and these cuts are already going into effect.  Then, we just did the fiscal cliff deal officially called the American Taxpayer Relief Act (ATRA).  Add those changes and you get the yellow/orange line.  Moreover, the CBPP goes on to estimate that another $1.4 trillion in revenue and/or spending cuts would bring the debt ratio at the end of the decade back down to around its current level.

The underlying message, as Krugman points out, is that while there may be budgetary and debt issues in the long run, the debt is actually pretty manageable for the foreseeable future.  

Thursday, January 10, 2013

How hot was 2012?

If you've been paying attention to the news, you may have heard that 2012 was the hottest year on record.  Here is the analysis by Climate Central.  Here is the chart that shows how much of an outlier 2012 is:

Meanwhile, Joseph Stiglitz has been arguing that the most serious long term economic threat is in fact climate change.  He is not alone in the view.  Here are some data points about how much climate change might cost. It estimates that the cost could be about $3.8B.  I think they are really low balling it.  For one, Tropical Storm Sandy is likely to end up costing over $50BN (some estimates put it at over $100BN) alone.

The question that Stiglitz and others are starting to raise is whether the focus should shift from trying to stop climate change (it is already a reality) to actually retrofitting the economy to deal with the new changed climate.  Provocative question!

Wednesday, January 9, 2013

Should Paul Krugman crow "I told you so"?

In 2010, Krugman had written an article captioned "The Austerity Myth".  In the article, he basically laid out a case that austerity was a really bad idea in the midst of a recession.  His opinion was that governments should expand in the midst of recessions and then move to austerity only after the recovery was well underway and the economy started to boom again.  This is basic Keynesian economics.  At the time, he was slammed by those on the right - remember the Tea Party was ascendant and Krugman seemed like a shrill and lonely voice.

As luck was have it, the world was about to witness the closest we've ever come to a controlled macro-economic experiment we can ever hope to achieve.  Faced with virtually identical banking crises driven recessions, the US and EU chose very different paths.  Obama and team pursuing a prescription that drew from the Keynesian formula.  Meanwhile, Europe chose a path based on austerity.  Given that the underlying crisis was the same and the economies were rather correlated before the crisis, this was sort of an experiment.  So, how have we done?

Well, the short answer is that the two have diverged significantly.

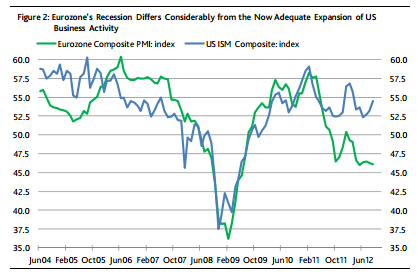
One article on the subject looked at economic activity using Moody's data:

diveregence Europe vs USA Economic Divergence Continues

As you can see, there has been a significant divergence between the two with the US growing, albeit slowly, while the EU is actually slipping back into recession.

Another article looks at stock performance.  As the article explains: "Stock markets don't perfectly reflect underlying profit streams, but profits are certainly the key component to equity price sustainability."


Again, the US is growing, the EU is not.

And now we have a damning report by Oliver Blanchard and Daniel Leigh at the IMF which basically lays this bare.  Here is their conclusion:  "... Our results suggest that actual fiscal multipliers have been larger than forecasters assumed. ... We believe, however, that a reasonable case can be made that the multipliers used at the start of the crisis averaged about 0.5. ... actual multipliers were substantially above 1 early in the crisis."

Let me play this back in plain English.  The actual negative effect of fiscal austerity, it turns out, was more than 2x what most economists prescribing austerity were assuming.  In fact, a multiplier of >1 means that for every dollar in fiscal cut, the GDP shrank by an amount greater than the fiscal cut.   Hmmm ... you know what, that sounds suspiciously like Krugman was right.

Tuesday, January 8, 2013

Is being overweight better for life expectancy?

If you believe a recent article in the NY Times  captioned "Our Absurd Fear of Fat" you'd conclude that being overweight but not obese is actually better for your life expectancy.  The article points to a recent piece of research published in the Journal of the American Medical Association which suggests that the relationship between mortality rates and BMI may not be quite as simple as suggested.  In fact, the research concludes that "Relative to normal weight, ... Grade 1 obesity overall was not associated with higher mortality, and overweight was associated with significantly lower all-cause mortality."

Let me play this back in normal English.  

BMI is a measure of weight proportionate to height.  It is considered a good way to determine whether a person is overweight.  Usually, BMI of 18.5 to 24.9 is considered normal.  People with BMI of 25 to 29.9 are considered overweight, while Grade 1 obesity is BMI of 20 to 34.9.   Usually, we are told that being overweight is bad and being Grade 1 obese is associated with substantially elevated risk of risk of a bunch of diseases including heart disease, diabetes, etc.

This research is suggesting that being overweight may slightly improve your chances of surviving longer and there is hardly any difference between Grade 1 obesity and normal weight.  

If true, this would be astonishing.  It is so counter intuitive that I decided to investigate whether there are other explanations.

The thing that bothers me about this analysis is that it suggests that the BMI has the same interpretation irrespective of what caused you to get to that weight.   

For instance, imagine someone who has an active lifestyle with moderate calorie intake vs someone that has ridiculously high activity with a very high calorie intake.  If their BMI was the same, would that mean the same life expectancy?  If people were machines, we'd probably conclude that the higher activity level leads to higher wear and tear which may in fact result in lower durability, or in human terms higher mortality than people with a more normal level of exercise and calorie intake.  Could it be that the elevated risk of being overweight is sometimes offset by the higher levels of wear and tear that one would need to to sustain to maintain that weight without reducing calorie intake?  I could not find any study that had specifically addressed this.


I also speculated that it could be because of factors such as smoking and illness.  Smokers are known to have lower weight for the same lifestyle.  Could higher incidence of smokers in the normal weight population be skewing the results?  Also, sick people generally lose weight, so could preexisting diseases be skewing the results?

I had more success with these latter speculations.  A few Google searches later, I found this fascinating piece of research that looks at several possible causes, particularly race, preexisting diseases, smoking and age.  

What they conclude is that once you adjust for preexisting conditions and smoking, you do see the risk of death increase as expected as you get beyond normal BMI.  However, a close look at the charts suggests that it depends on  the age of the participant  and that while the optimal BMI was somewhere between 23 and 26, the mortality risk was actually roughly the same for people who were thinner vs those who were slightly overweight.

At a high level, what this suggests that BMI does in fact affect risk of mortality but that we need to consider more than just the raw BMI in assessing risks.  We need to factor in how one got to the weight.  

A more practical point is that people who are overweight (not obese) probably don't need to obsess about weight and should instead focus on other risk factors that are probably significantly more predictive of their mortality risk than their weight.