Wednesday, October 31, 2012

Romney’s ‘math’ for jobs doesn’t add up

Mitt Romney says he will create 12 million new jobs.  This is an excellent and very detailed analysis of his plan.

For those who don't want to wade through it, here's a summary:

  • ~2.7 million to ~3.6 million jobs he takes credit for are expected to be created over the next eight years, largely because of trends and policies already adopted — including tougher fuel efficiency standards that Romney has criticized and suggested he would reverse.
  • ~2MM jobs comes from a 2011 International Trade Commission report, which estimated that there could be a gain of 2.1 million jobs if China stopped infringing on U.S. intellectual property rights, but it is unclear, to say the least, whether Romney's policies would seriously dent this.
  • 7 million jobs would be created from Romney’s tax plan is a 10-year number, derived from a study written by John W. Diamond, a professor at Rice University.  John Diamond assumes that all corporate deductions would be eliminated and most individual deductions too, which, as I have explained elsewhere, would actually mean a net tax increase on individuals (and John Diamond actually assumes the same).  Moreover, this figure assumes that more people will be looking for work, which does not necessarily mean they'll find work.
So, Romney can at best take credit for about ~2.8M jobs over 4 years.

Now, here comes the most curious bit.  Net net, under Romney's plan individual taxes will increase.  Also, tax burden will shift from richer to poorer people, and since the marginal propensity to spend of poorer people is less, this will actually reduce consumer spending and create a slight drag on the economy.  So, where is all this purported growth coming from.  Well, the answer is that most of it comes from the reduction in effective tax rates for Corporations.  And, the most interesting piece is that while Romney reduces his rates to 25%, Obama reduces his to 28% (with a penalty for multinationals and 25% for manufacturers).  Also, Obama retains a lot of the tax expenditures on companies.  So, net net, while Obama's proposed corporate tax rates are higher, they may not be all that much higher.  Nothing in this analysis compares the net jobs difference to Obama's plan.

My guess is that all said and done, the jobs numbers between the two are likely not going to be too different.  

Political party affiliation actually changes how you view the world

This is a piece by Ezra Klein that explains how political affiliations is correlated with people's view of the world.  He references a new Pew poll that shows:
With the election less than two months away, partisan differences in views of economic news have become wider than ever… Just 15% of Democrats say recent economic news is mostly bad, down from 31% a month ago and among the lowest percentages over the last four years. Six-in-ten Republicans (60%) say news about the economy is mostly bad, as do 36% of independents. Opinions among Republicans and independents are largely unchanged from a month ago.

l

This does not prove that there is a causal link.  It is possible that people who view the economy negatively have gravitated to the GOP and people who view it positively are gravitating to Democrats.  However, I am not sure that party affiliations are that fluid.  

Another possible hypothesis is that this is driven by the media these groups consume, i.e. it suggests that consumer sentiment is being driven by media, which in turn has a party bias.  

What Will Mitt Romney Do To My Taxes?

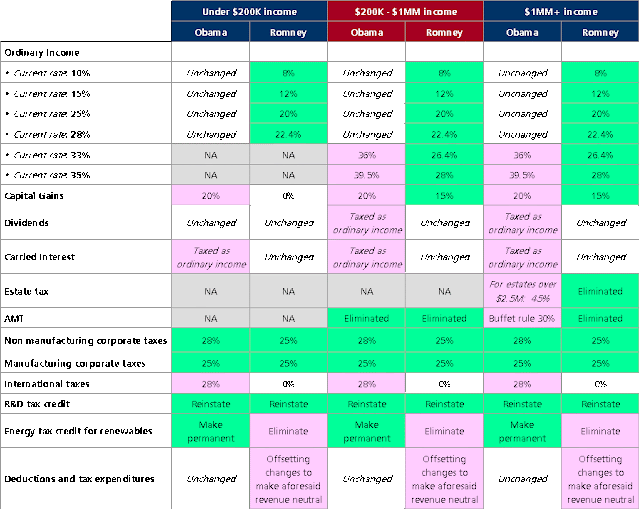
Mitt Romney's biggest promise is his simplification and reduction of taxes.  So, what impact will his taxes really have?  To assess this I used the excellent summary posted at bankrate.com to create the comparison below:


OK, but what in the world does this really mean? 

Well, the first thing you need to note is that according to the Tax foundation's summary of the Romney plan estimates that he will increase taxes as a percent of GDP relative to an extension of the current law (i.e. indefinite extension of the Bush tax cuts).  In fact, in 2015, the increase (using the CBO's estimate of the 2015 GDP), works out to ~$53BN more than under Bush.  Huh?  Did you get that?  While Romney is cutting marginal tax rates, Romney isn't cutting effective taxes, he's raising them.  

The way he's raising them is ostensibly through simplification of taxes.  What he proposes to do is to get rid of tax expenditures and tax deductions.  Great!  But, who will pay more?

Well, the effective federal tax rate for the top 1% of the country is actually higher than the 28% peak rate under Romney's plans.  That means that no matter what deductions he cuts for $1MM+ income earners, their effective tax rate is going to go down. This is not a matter of belief.  The effective tax rate cannot exceed the maximum marginal tax rate.  

So, clearly some or all of the rest have to pay more.  But, how much more?  Well, consider the following:
  • His proposed tax cuts will cost between $4T-$5T over 10 years, i.e. roughly $400BN a year, but he plans to increase taxes by $53BN.  To make that math work, he has to cut $453BN in tax expenditures and deductions.  
  • Tax expenditures Romney will likely cut are: deduction of state and local taxes, exclusion of capital gains on death, earned income tax credit and child tax credit and a host of teeny ones, the aggregate savings from these would be less than $200BN in 2015, i.e. he still would have a $250BN+ hole to bridge.  To fill this, he has to limit or eliminate tax deductions for Medical, Education, Child tax and Mortgage Interest deduction.
  • Romney says he will reduce taxes on under $200K income.  I have not personally done the analysis of whether this is even feasible (there are some studies Romney himself references that suggest no). However, let's assume he's right, well the effective taxes for under $200K goes down, the effective taxes for over $1MM goes down, but the net effect is tax neutral, so the effective taxes for the middle income group - $200K-$1MM income has to go up.
  • Finally, one of Romney's goals is to "increase the tax base" by the repeal of earned income tax credit.  That means anyone who pays low or no taxes is likely to see a tax hike.
To make matters worse, consider that:
    • Romney promises to increase defense spending by ~$2T over 10 years, i.e. $200BN a year
    • Romney's repeal Obamacare will, according to the CBO, actually increase the deficit.
    • In addition, the country currently has an annual deficit of roughly $900BN a year.
Romney is proposing a balanced budget.  So, he has to make up roughly $1.1T a year.  So, he could not close the gap even if he cut all non defense discretionary spending.  That means he has to cut Medicare, Medicaid and Social Security spending in some way.  

So, to summarize:

  • $1MM+ income will pay less
  • $200K-$1MM income will likely pay more
  • People who don't pay taxes will likely pay more
  • Rest will likely be neutral 
  • Corporate taxes will likely go down for companies that pay more than 25% in effective taxes, and go up for everyone who pays less

Now, if you are like me, you are probably wondering how is Romney going to keep all his promises?  After all, isn't all this likely to be very unpopular?

Well, the short answer is he probably won't keep his promises.  Why do I say this?  Well, that's what history tells us.  Here is the deficit increase by Presidential term.

As you can see from the chart above, Democratic Presidents have been incredibly responsible about the debt.  The GOP Presidents, not so much.  What's going on is that the GOP Presidents in the last 30 odd years have consistently cut taxes, promised to cut spending, then not delivered on the latter, resulting in massive deficits and borrowing.  There is no reason to believe that Romney will be any different.

So, the vast majority of us will either likely see a tax increase or will see a tax cut on a credit card.  Choose your poison.

(Oh, and in case you are wondering about Obama.  

  • Under $200K income - neutral.    
  • Between $200K-$1MM income - depends on the composition of your income.  AMT repeal may offset the sting of higher marginal rates.  
  • Over $1MM income - higher taxes.
  • Among companies - multinationals and oil companies lose, most others gain.)
PS:  For a very fun game to try and make Romney's plan add up, try this link.

Understanding the polls

There is a massive discrepancy between National polls and State polls.  The National polls put Romney ahead.  The State polls suggest Obama has the edge.  This article by Nate Silver is an excellent summary of the issues involved and this is another that examines the issue in a slightly different way.  

The short summary is that we don't really know why National polls are disagreeing with State polls.  Essentially, if you take a weighted average of state polls it should equal the national polls.  Except, currently that isn't what is happening.  Simple explanations like non competitive state margins don't quite seem to explain it.  It's tempting to argue that it is because of "sampling error", but there would have to be a pretty significant bias in the state polls for all of them to skew so dramatically to Obama.  Nate Silver and others believe that state polls may be more unbiased and their larger samples make them more stable.   Another hypothesis is that things are being messed up because the "likely voter" models are wrong - that there are state by state differences which pollsters are inadequately adjusting for.  However, we won't know for certain until the results, and perhaps not even then.  


Tuesday, October 30, 2012

The US economy in 13 charts


1.     The US economy is back to pre-recession levels and growing. 


2.  The US has a long term advantage over other developed economies as it is one of the few with a positive working age population growth (India has an advantage here too):


3.  This is not a jobless recovery.  In fact, the US economy has added jobs at a faster clip in this recession than in the 2001 recession and the 1981 recession. 


There is an even more detailed analysis of this at Ezra Klein's Wonkblog here.


4.  US wages are rising for those employed.


5.  US disposable income is up.


6.  The reason it doesn't feel that great is the recession was one of the deepest in recent memory.


7.  The economic recovery has been different in different sectors with Construction, Information (IT), and Government having seen no recovery while most other sectors in growth.  Education, Health, Mining, Lodging, Leisure and Professional Services are back to pre recession levels.


8.   Employment change has hit different professions differently, suggesting businesses are shedding non essential staff and construction is in the doldrums.  Employment in line functions are in growth.


9.   The insistence on smaller government may be holding the economy back.   As you can see, private sector consumption is up, public sector is down.


10. Unemployment may be higher because of the insistence on smaller government.  In fact, the Hamilton Project notes that if the normal path of employment growth over the 2000s persisted, there would be 1.7 million more government jobs:


11. Educational attainment is a huge part of the problem with unemployment, suggesting potential structural issues.  For instance, the high unemployment rates are largely driven by people with no college education: 


12. 50% of the unemployed don't have any college education, 79% have less than a bachelors qualification.


13. This problem has been getting worse because, while good jobs for college or more have held steady, good jobs for high school or less than high school people have been dwindling.