Sunday, December 30, 2012

Recreational mathematics

Vihart's videos on mathematics are brilliant and a treat to watch.  Here are a few of my favorite ones:
  • This one is a great use of "fruit by the foot"
  • This is a great Origami proof of the Pythagoras theorem

  • The most innovative story I've seen:

  • This one is a fun binary hand dance for Pi 

  • and one of my favorite ones is this one on fractal fractions (reminded me of some of my schoolteachers who took great pleasure in unnecessarily complicating math)

Check out her posts.

Friday, December 28, 2012

On the US gun culture ...

The recent tragic mass killings in the US have been unfathomable.  It seems beyond belief that a gunman could turn a gun on little children and shoot not just once but multiple times.  The killings have ignited a debate on whether the US needs tighter gun laws.

The chart below shows the gun deaths per 100,000 people for countries with per capita GDP of $30K+.  It shows just how much of an outlier the US is for gun deaths. 

The US has some extraordinarily lax gun laws.  This post at the Wonkblog examines just how permissive US gun laws are.  They also have a post with some facts on guns which show that:
  • Mass shootings are not all that rare in the US with at least 61 mass murders since 1982;
  • In most cases, the gunmen in the shooting obtained the guns legally;
  • 15 of the 25 worst mass shootings in the last 50 years took place in the US;
  • High gun ownership does not always translate into higher gun violence;
  • Of the 11 deadliest shootings in the US, 5 of them occurred since 2007;
  • America is an unusually violent country. But we’re not as violent as we used to be.
  • Gun ownership in the United States is declining overall.
  • More guns tend to mean more homicide.
  • States with stricter gun control laws have fewer deaths from gun-related violence.
  • Gun control, in general, has not been politically popular.  In a separate post, the Wonkblog points out that the lack of popularity can be explained mostly by NRA membership, i.e. gun owners who are not NRA members tend to support stricter gun laws.
What caught my attention are the studies the Wonkblog cites to suggests that there is correlation between high gun ownership and homicide rates which seems interesting to say the least.  

Mother Jones has a fascinating article analyzing mass shootings in the US since 1982.  The most interesting chart they've posted is the following, which does suggest that some types of weapons are significantly more likely to be implicated in a mass shooting. 


None of these conclusively prove that gun control reduces gun violence but it does suggest that the US is a an outlier and that semiautomatic hand guns and assault weapons are the preferred weapons in mass killings.

What is fire?

I was recently explaining to someone what fire is and realized that there are people who have done this already and done so much better than I ever could.

Alan Alda had posed a challenge on NPR to explain what is a flame is to an eleven year old.  This was the winning video.  It's excellent:


I actually also like Feinman's explanation here:


My favorite part of Feinman's explanation is he brings out the wonder and the inter-connectedness of nature in a way that is wonderful!

Tuesday, December 25, 2012

Federal tax contribution by state

In an earlier post, I had posted the net contribution to Federal government by state as sourced from Wikipedia (i.e. how much the state contributes by way of taxes less the benefits they receive from the Federal Government):


There were a number of people who asked me whether this view is being somewhat distorted by the size of the state.  So, here's the same statistic computed per capita:


What appears to be true is that states with larger populations, as one might expect, have a larger positive net contribution to the Federal government (the correlation coefficient of a state's net contribution to its population is 24.48%).

I ran a little regression and what it suggests is there isn't enough data here to conclude anything and if anything, normalized for states' sizes, although states that voted for Obama were more likely to have a net positive contribution, this isn't statistically significant.

Wednesday, December 12, 2012

Roma are from Northern India

A fascinating piece in the New York Times suggests that genetic research appears to confirm that the Roma (Gypsies) originated in Northern India and likely left India around 1500 years ago.

Interesting on many dimensions.

The Roma are the largest minority group in Europe.  Millions of Roma were killed in the holocaust.  They've been persecuted over the ages (Gadjo Dilo is an interesting movie on the topic).  They've also had astonishing impact for a nearly universally despised people, particularly through their music.

Wikipedia has an interesting discussion of the Romani language.

The state tax deduction ...

In a recent post in the Washington Post, Charles Lane argues that the least defensible deduction is the deduction State and Local Taxes.  His rationale is that this is "this one overwhelmingly benefits upper-income households in a handful of upper-income states, while rendering the entire nation’s finances less transparent."   Later in the article, Charles Lane explains his real rationale for picking this as the least defensible deductions: "But because its impact is so heavily concentrated in blue states, the state and local deduction creates an asymmetry: Democrats have an extra reason to insist on raising rates, and Republicans have an extra incentive to demand loophole-cutting. Perhaps it’s just coincidence, but I have noticed that those most skeptical of the loophole-closing approach include Sen. Charles Schumer (D-N.Y.) and House Minority Leader Nancy Pelosi (D-Calif.)."

When I read his analysis I was struck by a number of issues that I thought I should clarify.
  • Is it unfair to tax taxes already paid?
Here's Charles Lane on the subject: "Taxpayers have been allowed to deduct state and local income and property taxes since the federal income tax began in 1913. (Sales taxes have at times been deductible, too, but that’ s a relatively minor issue.) The theory is it’s unfair to make people pay twice for the public services they receive. That’s doubtful, though, since, despite some overlap, federal taxes support different services than state and local."

Hmm ... let's consider a thought experiment.  Let's say state and local taxes were 60% and Federal taxes were also 60%.  At this point, if the State and Local tax deductions were allowed, the effective tax rate would be 84%.  Under Charles Lane's formula, you could not claim the deduction for State and Local taxes and so the effective rate of taxes would be 120%, i.e. more than aggregate gross income.

I am not sure that there is a positive test for a relatively normative issue like "fairness".  However, if something is structurally unsound enough to result in absurd answers like taxes owed being higher than the gross income, it comes pretty close to QED.  

This is why, as Charles Lane himself acknowledges, the deduction for State and Local taxes has been part of the code since 1913 when the Income tax was introduced.

  • Isn't this mostly a deduction for rich people? 
Well, yes.  It is.  However, that isn't unusual.


As you can see, while state and local taxes are somewhat skewed towards the higher income, it is by no means the most skewed - that honor goes to Capital Gains and Dividend Tax reduction.
  • Are Blue states mostly takers and Red states mostly makers - i.e. isn't this a handout to taker Blue states?
In one sense this isn't wrong.  After all, if Blue states have higher effective taxes, the deduction disproportionately benefits them.

In another sense this isn't right.  Here's a view of net contribution to Federal government sourced from Wikipedia (i.e. how much the state contributes by way of taxes less the benefits they receive from the Federal Government):

Of the 24 states that voted for Romney, 19 had a net deficit, i.e. they contribute less to the Federal Government in taxes than they collect in Federal spending.  By contrast, 14 of the 28 states and territories that voted for Obama had a net deficit.  In fact, the aggregate for all the states which voted for Romney was a deficit of $64,911 million, whereas the aggregate for the states that voted for Obama was $206,848 surplus.  Let me restate that, the red states contributed less in taxes than they collected from the Federal government, the Blue states by contrast contributed more in taxes than they collected.

This is important because the argument hinges on the conflation of blue states and high taxes with "moochers".  Turns out that this conflation is probably not right.

Changing topics a bit, as an aside, the chart of the percentage of the deduction that goes to the rich shows that a lot of these deductions are actually designed to assist those with lower incomes.  So, when someone is arguing the removal of deductions to "widen the tax base" they mean a middle to lower income tax hike.  This raises an interesting question:  just how egregious is the tax on the higher income to necessitate such base broadening?  

Well, one way to think about this is to compare the effective tax rate for those at the higher income levels, i.e. with incomes over $100K, to those of other countries.  It just so happens that the Economist has done just that recently:

Strangely, the US' effective tax rate for $100K+ income is among the low end of the spectrum of the selected countries and will likely remain so even if the proposed marginal tax rate hike goes into effect for those with $250K+ income.

Interesting date

If you have not noticed, today is a very unusual date: 12/12/12.

This will be last time that we will be able to abbreviate the date in a way where the day, month and year are the same number for a very long time.  The next time this is going to happen is on 01/01/2101 - which can be abbreviated as 01/01/01.  That's 89 years from now. :)

Friday, November 30, 2012

Some random stuff on economy etc ...

I have been meaning to post some interesting analysis of the elections etc.  Meanwhile, let me post some links that make interesting reading:

  • As Dylan Matthews has posted here and analyzed by Brad DeLong, the potential of the US GDP has been declining, at least in the CBOs view.  There are some fundamental issues affecting the US besides the budget.

  • Finally, Stuart Stevens, Romney's chief strategist, has written a very interesting piece on Romney's loss.  He accepts no responsibility whatsoever for the loss.  His most interesting comment is that Romney won every economic group except those who earned less than $50,000 income.  This is factually correct as you can see here.  Except, that's roughly 41% of the voters and Romney lost the group by 22 points.  In fact, he's lucky.  The US median income is ~$50K.  So, what he just said is that Romney lost badly among a group that constitutes half the population.  Hmmm ... just a math question here, how was he planning to win the election while losing among such a large chunk of the population by 22 points?

Saturday, November 24, 2012

The deficit is shrinking

In an earlier post I had shown that a significant portion of the Federal budget deficit is actually due to the economic downturn.  This would suggest that as the economy has started to grow and the stimulus has worn off, the budget deficit should start to shrink.  I just saw this interesting post by Suzy Khimm showing that's exactly what is happening.  In fact the recent deficit reduction is one of the fastest in recent history, as you can see from this chart:


Friday, November 23, 2012

An economic analysis of the top tax rates

The Congressional Research Service, at the behest of Congress, recently studied the top marginal rates and their impact on the economy.  Here's their conclusion:

"The top income tax rates have changed considerably since the end of World War II. Throughout the late-1940s and 1950s, the top marginal tax rate was typically above 90%; today it is 35%. Additionally, the top capital gains tax rate was 25% in the 1950s and 1960s, 35% in the 1970s; today it is 15%. The average tax rate faced by the top 0.01% of taxpayers was above 40% until the mid-1980s; today it is below 25%. Tax rates affecting taxpayers at the top of the income distribution are currently at their lowest levels since the end of the second World War. 

The results of the analysis suggest that changes over the past 65 years in the top marginal tax rate and the top capital gains tax rate do not appear correlated with economic growth. The reduction in the top tax rates appears to be uncorrelated with saving, investment, and productivity growth. The top tax rates appear to have little or no relation to the size of the economic pie. 

However, the top tax rate reductions appear to be associated with the increasing concentration of income at the top of the income distribution. As measured by IRS data, the share of income accruing to the top 0.1% of U.S. families increased from 4.2% in 1945 to 12.3% by 2007 before falling to 9.2% due to the 2007-2009 recession. At the same time, the average tax rate paid by the top 0.1% fell from over 50% in 1945 to about 25% in 2009. Tax policy could have a relation to how the economic pie is sliced—lower top tax rates may be associated with greater income disparities."

Their conclusion was promptly rejected by the GOP as biased and flawed.   You can read the report and make up your own mind.

Saturday, November 17, 2012

Is Romney's "gifts" comment accurate?

In a recent conference call of big-dollar donors, Romney explained why he had fallen short in his race for the Presidency by saying President Barack Obama had bribed liberal special interests with expensive gifts.  Here's a YouTube clip of the call.


Here’s what he said, according to The New York Times:

With regards to the young people, for instance, a forgiveness of college loan interest, was a big gift…Free contraceptives were very big with young college-aged women. And then, finally, Obamacare also made a difference for them, because as you know, anybody now 26 years of age and younger was now going to be part of their parents’ plan, and that was a big gift to young people. They turned out in large numbers, a larger share in this election even than in 2008 … You can imagine for somebody making $25,000 or $30,000 or $35,000 a year, being told you’re now going to get free health care, particularly if you don’t have it, getting free health care worth, what, $10,000 per family, in perpetuity, I mean, this is huge … Likewise with Hispanic voters, free health care was a big plus. But in addition with regards to Hispanic voters, the amnesty for children of illegals, the so-called Dream Act kids, was a huge plus for that voting group.
Let's leave aside the politics and the normative question about whether this the right attitude for a second.  Let's also leave aside the question as to whether "gifts" as described by Romney are materially different from targeted tax cuts and other policy pronouncement by Romney himself.  Let's look at whether his underlying assessment of why he lost is true.
In this excellent post at the Washington Post, the examined precisely this question.  They examine how Obama did in 2012 with the constituencies that Romney mentions vs what he did in 2008.  I took the liberty of adding the 2004 data for Kerry from CNN's exit polls where available.  Here's the data:
Voters ages 18-29 [percent of overall vote: 19 percent in 2012, 18 percent in 2008; 17 percent in 2004]
2012: 60 percent       2008: 66 percent    2004: 54 percent

African Americans [percent of overall vote: 13 percent in 2012, 13 percent in 200811 percent in 2004]
 2012:   93 percent    2008: 95 percent    2004: 88 percent

Hispanics [percent of overall vote: 10 percent in 2012, 9 percent in 20088 percent in 2004]
 2012: 71 percent    2008: 67 percent    2004: 53 percent

Non-married women [percent of overall vote: 23 percent in 2012, 20 percent in 2008]
 2012: 67 percent   2008: 70 percent
In the Washington Post article, they conclude that this data conclusively proves that Romney's comment is wrong.  I am not as emphatic.

In one sense Romney has a point.  As seen above or as I posted earlier, Romney got less support among the young and among Hispanics relative to Bush in 2004.  
However, Romney appears to be suggesting that this is a new coalition persuaded by "gifts" to join Obama, i.e. that  these people were in Romney's camp and were won over by the "gifts".  In fact, this isn't correct.  In virtually every case, except Hispanics, Obama's support actually declined with the group in question relative to 2008, i.e. Obama had already built this coalition in 2008.  So, to believe Romney's comment, you'd have to believe that Romney was making significant inroads into Obama's 2008 coalition and that Obama offset Romney's advantage with gifts.  There is insufficient data to suggest this.  The simpler explanation is that Obama built a coalition in 2008 and did enough in his first term to satisfy the people who already supported him to continue to support him.  Since these people were already in Obama's camp, the key question for Romney is what did he do to win them over?

Government Spending

Suzy Khimm posted a new blog post at Ezra Klein's Wonkblog examining Federal spending projections.  The post uses data from five think-tanks commissioned by the Peterson Foundation to come up with their own plans for reducing the deficit over 10 and 25 years: the Center for American Progress and the Economic Policy Institute on the left; the American Action Forum and the Heritage Foundation on the right; and the Bipartisan Policy Center in the middle.  Here's the relevant chart:


There are two interesting points.  First, that expenses will skyrocket if `we don't do anything (current policy).  Secondly, that the sequester (current law) actually fixes the issue.

The debate now isn't really about whether there will ultimately be cuts like this - there likely has to be something similar at some point.  The point now is who pays and when.

Friday, November 16, 2012

Why Romney lost and other suchlike

There are a lot of memes about the 2012 Presidential election.  However, not all of them are accurate.  Here are some of the facts. 


  • Was Obama's victory "huge" by historical standards?

One of the common memes is that this was a huge win for Obama.  One reason for this meme is clearly the extent to which Obama beat expectations.  However, by historical standards, Obama's win isn't all that big.  It's about middling in terms of popular vote (note Roman numbers against the name indicates which term).


In terms of electoral votes the election too, Obama's performance was middling at best.


Some factoids:

  • As far as I can make out no President before Obama has ever won reelection with fewer absolute votes in the second term than in the first - he got ~6MM fewer votes
  • Obama is only the second president (Andrew Jackson was the first) to win a second term with a reduced percentage of the popular vote
  • Obama is only the third president (after Madison and Woodrow Wilson) to win a second term with a smaller percentage of the electoral vote.
  • Obama is one of only four Presidents in the last 100 years to win 50%+ of the votes in all their terms (the others being FDR, Eisenhower and Reagan)
  • This is only the second time in US history where there has been three consecutive two term Presidents. The last time this happened was between 1800-1824 (Jefferson, Madison, Monroe)


  • Was there a huge shift in the composition of voters?
The age distribution did shift in strange ways.  Most significantly, there was a reduction in the share of 60+ voters - did the Medicare attacks work?  


In race distribution, share of white voters went down, however, not quite as dramatically as the news media suggests.


Also looking closely, the rise in African American voters equals the rise in Hispanic voters followed by Asian voters.  In terms increase as a percentage of their population, the most massive shift was among Asians.


  • What were the key changes between Bush's win in 2004 and Romney's loss in 2012?


The first thing to note is that Obama's weakness with White voters isn't so much an Obama thing as a Democrat thing.  This poll looked white support for Democrats and shows that while Obama significantly under performed Clinton and Kerry with White voters, Democrats have had a problem with White voters for over 40 years, at least.


The chart below parses the change in votes for Bush in 2004 and Romney in 2012 by race and gender.

Here's the strange thing.  Romney actually did just as well among white men as Bush in 2004, and actually did better among white women than Bush in 2004.  

In fact, more than 50% of the difference is due to demographics of voter turnout - i.e. the higher share of Hispanics, African Americans and Asians.  Romney seems to have experienced a dramatic erosion in support among non white women.

As seen below, looking at race more closely we find that apart from the shift in voter mix to more non whites, the loss in support among Hispanics seems to be one of his biggest issues.


As an aside, I didn't have the age distribution cross tabulated against race and gender.  However as a standalone, it appears that Romney really lost support among the under 45 voters relative to Bush.  Older voters went for Romney.  Also, the slightly younger skew in the electorate worked against Romney - but this effect was actually smaller than the loss of support among younger voters.


What's the bottom line?


Overall, erosion in support among younger voters and non whites particularly Hispanics appear  to be major causes of Romney's loss.  


David Brooks said on NPR that the introspection on the GOP loss takes three flavors: (a) those who feel that the GOP was not conservative enough, as stated here; (b) those who believe that the GOP needs to hold fast to their policies and give a little on immigration, e.g. Krauthammer; and (c) those who believe the GOP must restate their case, e.g. David Brooks himself.  Kathleen Parker makes an exceptionally impassioned case for the third way which is best summed up by her line: "The truth is, Romney was better than the GOP deserved."

We'll see which explanation the GOP settles on.  

Here's my hypothesis.  

The Democrats' view is that Government's role is to help those who need help.  The problem with this approach is that helping people invariably creates the free rider problem - i.e. when government starts handing out money to people, a lot of people are tempted to just take the money and mooch off the system.  This is exactly the resentment that the GOP has been successful at tapping into - the resentment that hardworking people pay more taxes to fund free riders and moochers.  However, the GOP's answer is that all largesse is bad.  Their focus on tax cuts essentially argues that anyone who isn't a free rider clearly earns money and a tax cut is the best way of giving them back their money.  Romney went one step further, essentially equating free riders with all recipients of government's largesse, which a largely incorrect juxtaposition but still taps into the same underlying sentiment.

I am not sure how well this story line jives with immigrants.  Most immigrants make immense personal sacrifices to come to the US to seek a better life.  Their work ethic and attitude does not involve free riders.  Their social circle does not include many free riders.  The GOP bogeyman of free riders therefore seems unreal.  On the other hand, they are familiar with a lot of hard working people seeking the American Dream who are not successful.  They cannot understand why the US should not be lending a helping hand to people who are so obviously trying to get ahead and need only the opportunity.  

So, it isn't so much that immigrants trust government more, it is that their fear of free riders is much less as the attitude that drives the fear is somewhat alien to them.

If I am correct then, to win over the non white vote, the GOP needs to distinguish between genuine free riders and the hard working who are just down on their luck, i.e. my guess is that David Brooks and Kathleen Parker are more than likely right.

Thursday, November 8, 2012

2012 Elections a Win for Math and Suchlike

The 2012 election was a huge win for mathematics as well as for Obama.  Nate Silver and all the other poll aggregators had been panned before the election by commentators such as Michael Gerson. On Tuesday, the math based aggregators were vindicated.  TPM PollTracker, HuffPost Pollster, the RealClearPolitics Average, and the Princeton Election Consortium all called the election correctly.  However, my favorite one, Nate Silver was king!  Nate Silver picked the winner in all 50 states (better than his 49 out of 50 in 2008).  He had predicted Obama's total vote total would be 50.4% and Romney's would be 48.3%.  The actual numbers were 50.8% for Obama, just four-tenths of a percentage point higher, and 48% for Romney's 48, just three-tenths of a point lower for an average miss of just 0.35 percentage points.   

What helped Obama win?  One of the best graphics on this was posted at the NY Times:


Saturday, November 3, 2012

War Casualties

One of the interesting factoids I heard on a conservative talk show was that US troop deaths had tripled under Obama and that this was being suppressed by the "liberal media".  It was such an interesting statistic, that I decided to check it.  Here's a chart of US fatalities:


It turns out that 2008 onwards overall fatalities have dropped dramatically.  During 2005-2008, fatalities averaged 839 per year, whereas in 2009-2012 its averaged 445, i.e. roughly half.  

However, what is also true is that Obama's surge in Afghanistan has tripled the deaths in Afghanistan.  During 2005-2008, fatalities in Afghanistan averaged ~117 per year, whereas in 2009-2012 its averaged 379, i.e. more than triple.

I suppose the reason why this isn't an issue is that both candidates essentially agree to a 2014 exit from Afghanistan and so neither party has a substantively different strategy.

Obama's Incredibly Bad Idea

One of the proposals Obama has put forth that has received scant attention is the idea that US companies would have to pay taxes on their global income and not just on their US income.  Given how bad an idea this is, it is surprising that it hasn't received more attention.

Obama's corporate tax proposal has five key elements:
  • It lowers the corporate tax rate to 28%
  • It caps the corporate tax rate for manufacturers at 25%
  • It imposes a 20% AMT on foreign profits irrespective of whether companies bring those profits back (although it does allow the deduction of foreign taxes paid)
  • It introduces a 20% tax credit for moving operations to the US and disallows deduction of expenses related to moving operations abroad
  • It eliminates a host of deductions to simplify the tax code, making these changes somewhat revenue neutral 
The aforesaid changes introduces a significant change in how multinationals are taxed.

Currently, not only does the US have one of the highest corporate tax rates in the world, but the US is one of the few countries that does not use a territorial tax treatment, i.e. unlike other countries which tax income earned within their borders, the US taxes global income and not just US income.  However, there is a pretty big loophole.  Multinationals are only taxed on the  foreign profits they bring back to the US.  So, they can effectively indefinitely defer paying taxes in the US by not bringing the profits back to the US.

To fix the loophole, Obama has proposed a 20% alternate minimum tax on foreign income.  

To understand why it is bad, consider a thought experiment.  Imagine that India decides to encourage the car industry and reduces corporate income tax rates for car companies to zero. Car companies from around the world would suddenly find the Indian market more attractive.  However, under Obama's tax rule, US car companies would still need to pay the 20% rate in the US.  That means US companies operating internationally would suddenly be at a huge disadvantage, earning upto 20% lower returns than companies incorporated elsewhere.

The counter argument is that US companies would not be tempted to park money abroad as there would be no advantage to parking the money abroad.  However, the same could be said if the US moved to a territorial tax system.  If companies no longer had to worry about getting taxed on foreign profits they bring back to the US, they would have more incentives to bring the money back.  Not having a territorial tax system actually deters companies from repatriating foreign profits.  Moreover, taxing income in foreign countries seriously affects the competitiveness of US companies.

The only saving grace is that even if Obama wins, its highly unlikely that this proposal will make it past the GOP dominated House.

Friday, November 2, 2012

Recent History of US Economy in a Few Charts

This is a series of simple charts that look at the performance of the US since about 1977.  Blue indicates a Democratic President and Red a GOP President.

  • Growth rate of the US has been mixed.  


  • Federal debt has been ramped up more when GOP Presidents were in charge:


  • While under Carter grew spending dramatically, federal spending grew more under Bush I, II and Reagan than under Clinton. Under Obama its actually grown less than under Bush II (even including the stimulus).

  •  Effective Federal tax rates have generally been lower under GOP Presidents

  • The tax rate has actually grown more progressive under Bush II as measured by the spread between the average effective tax rates for the top and bottom quintiles.

Do Capital Gains and Top Marginal Tax Rates Cuts Spur Growth?


The GOP asserts the prima facie quite believable presumption that:
  • Tax cuts for the wealthy, particularly, tax cuts on capital and the rich encourages investments and results in growth; and
  • Tax cuts on the poor does not generate nearly as much growth, partly because the poor are not a big part of the economy.

The logic of lower taxes on capital gains and higher income is that it encourages risk taking, which leads to investment and subsequent growth at higher multiple than simple consumption led growth.  This makes sense, right?  

Let's look at what the data tells us.  I'll divide this into five questions:
  • Do Capital Gains tax cuts lead to growth?
  • Does cuts in peak marginal tax rate lead to growth?
  • Does cuts in Capital Gains taxes lead to increases in savings?
  • Are tax cuts to poorer people more likely to result in larger consumption increases?
  • Is consumption by poorer people significant enough for the tax cuts to matter?


OK, so here's some data:

  • Here is a chart plotting Capital Gains tax rates and economic growth in the US:


There is +ve correlation between Capital Gains tax rate and growth - i.e. it seems that the higher the Capital Gains tax, more the growth.  This, in my view, is coincidence.  I think, however, it does suggest that there is no clear strong relationship between the two.

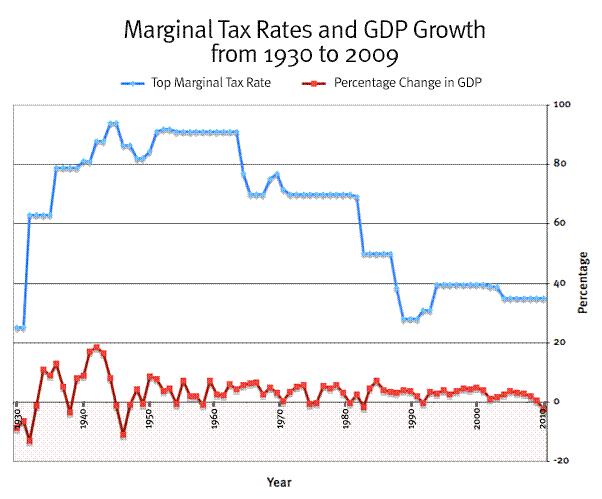
  • What about the top marginal rate?  Well here's the chart of top marginal rate of tax and GDP growth rate in the US:


Again, we can see no correlation between the two.  There is simply no evidence that taxes on the very rich has any impact on growth.

  • Let's examine a more fundamental assumption, the savings rate trend.  Capital gains taxes were cut - early 1990s and again early 2000.  Reagan actually raised it in the late 1980s.  The trends are actually very mixed at best as to what the effect of these changes were.  Slate examined other countries and found similar questionable effects.  As an aside, personal savings in the US is currently at an all time high.  The problem at the moment is that government cutbacks are offsetting this.


  • .     Are tax cuts to poorer people more likely to result in larger consumption increases?  The chart below shows the marginal propensity to spend per unit dollar in post tax income.  As you can see, the propensity to spend per unit dollar in income keeps dropping.  As this chart shows, if you give someone with less than ~$40K in income a tax cut, 100%+ will be spent.  If you give the same tax cut to a $100K+ spender, less than 65% of it will get spent.      


  • 2.   Finally, do these poorer people spend enough for it to matter? The portion of consumers who account for under $40K income account for 25% of total US consumer spend.  In fact, the marginal propensity to spend does not drop to under 80% until you get beyond $70K in income, which means it covers 47% of all spend.  That's a LOT of spend.  To put it in perspective, consumer spending is about ~70% of US GDP.  This would suggest that the lower income people account for ~$4.7+ trillion in spend.  This does not include the effect of velocity of money, which would increase the effect.


These charts are only directional.  (The top marginal rate impact is less controversial, I assume). For a more thorough analysis, you can read the CBO's analysis of Capital Gains taxes.  Here is their conclusion on the effect on growth:

"The JCT’s and OTA’s cost estimates include the feedback effects that gains tax rate changes exert on the tax base through the realizations response. But they do not include the revenues that might result from the effects on overall economic activity. That omission has been criticized as a failure to perform “dynamic” scoring. Critics often claim that the omitted feedback effects on output, and thus revenues, are substantial, and that not taking them into account both biases policy against cuts in capital gains taxes and contributes to large forecasting errors. Yet feedback effects on growth are likely to be small, and their omission from cost estimates has no bearing on the accuracy of CBO’s budget projections, which include growth effects.  In general, there is significant consensus that broad-based reductions in taxes on capital have the potential to boost economic growth over the long run. Reductions in capital taxation increase the return on investment and therefore the formation of capital. The resulting increase in the capital stock yields greater output and higher incomes throughout much of the economy.  But the potential for big growth effects from a capital gains tax cut is much smaller than it is for a more general cut in the tax on capital. For example, Congressional researchers estimated that a cut of the magnitude proposed in 1990 or enacted in 1997 (25 percent to 30 percent) would reduce the tax on corporate capital by only 2.7 percent and would decrease the cost of capital by less than 1 percent.

Some additional reduction in the cost of capital might result from the salutary effects of improved liquidity as a consequence of less lock-in. But such an impact would also be small. One reason for those limited effects is that about half of gains are not taxed anyway because they are associated with assets whose basis is stepped up at death. A second reason is that although a cut in capital gains taxes helps reduce the cost of capital, it only affects the cost of a portion of a firm’s financing. It has no effect on the roughly one-third of corporate investment financed through debt.  And it does not affect the estimated half of the return on equity-financed capital that comes in the form of dividends, which are subject to regular rather than capital gains tax rates. A third reason is that the tax rate on gains is already low relative to regular rates, so even a large percentage cut in the gains rate would have a relatively small effect on the cost of capital. Reducing the taxes imposed on the return from capital raises investment demand, but an increase in the capital stock depends as well on how much of its resources an economy makes available for investment—that is, how much it saves and how much capital it attracts from abroad. Analysts disagree about the effect on saving of cutting taxes. And the availability of resources would also depend on how the government financed any loss in revenue resulting from a tax cut. If the loss was offset by reduced spending, the outcome would be increased economic growth. If it was not offset, the cut’s overall impact on the economy might be negative: its growth-promoting effects on investment demand could be insufficient to overcome either the decline in investment resources resulting from additional government borrowing or the effects of the government’s need to raise taxes later to make up for the lost revenue."

A few points to think about:
  • If there is no demand, would you invest?   The problem with the "investment cost" theory to begin with is that the cost of investment is only a secondary consideration in growth.  It only matters if there are a huge number of investment opportunities that people are walking away from because of cost of capital reasons.  However, when there is a growth problem, it is usually the case that there are no attractive investment opportunities.  Capital cost cuts don't help. 
  • Secondly, and this is a critical component usually missed in the usual critique of the constrained investment theory, taxes are not a very material part of the cost of investments. Let's say you invest at a pre-tax rate of return of r.  Now your pre-tax hurdle rate for investing is say i and the tax rate is tc for capital gains and ti for interest (to simplify matters I am assuming it’s the same for investments and cost of funds).  Then it's profitable for you to invest as long as: (1 + r*(1-tc)) / (1 + i*(1-ti)) >1.  So, a rise in the tax rate (tc) will reduce the attractiveness of the investment.  But, here's what people miss.  All other things are NOT equal.  The attractiveness decrease could be offset by adjusting the cost of capital, i.  The cost of capital is very closely monitored and controlled by the Fed by controlling money supply.  The effective cost of capital depends on monetary policy.  So, as long as Capital Gains tax or tax on the rich is within reason, monetary policy can completely offset any constraining effect the tax has on cost of capital.
  • A final point that the CBO report touches on might be worth calling out as reporters seem to miss this - capital gains tax is not a tax on capital, it is a tax on appreciation of excess parked funds.  So, much of what people think of as investments are NOT covered.  Consider the following:
    • IRA accounts are not subject to capital gains tax;
    • 401K and pension fund withdrawals are taxed as ordinary income, not capital gains;
    • Investments by institutional investors, e.g. hedge funds, most banks, etc. are taxed as corporate income from ordinary sources, because investments held for trading purposes cannot be considered capital.

I call this out because while I don't have the statistics, I imagine that a sizable portion of investments actually do not qualify for capital gains tax relief. 

As an aside, there is one place where tax on investments does have an impact and that is the stock market.  There is evidence that the stock market tends to go up if you cut capital gains taxes (have not shown the data here, but have seen it before).  However, again, this is a short term effect.  Ultimately, the Fed can manage this too through monetary policy.